A Google Sheets template for designing A/B tests. It helps you structure an experiment before launch — from writing the hypothesis to calculating how long the test should run.
What’s inside
Experiment description — a hypothesis written in the format: «If [product change], then [target metric] will change by [expected result], because [research data].» This section also captures the target metric and the experiment start date.
Baseline values — the parameters used for calculations:
- Monthly visitors and conversions
- Traffic share for each variant (50% by default)
- Baseline Rate
- Confidence Level (1−α) — 95% by default
- Statistical Power (1−β) — 80% by default
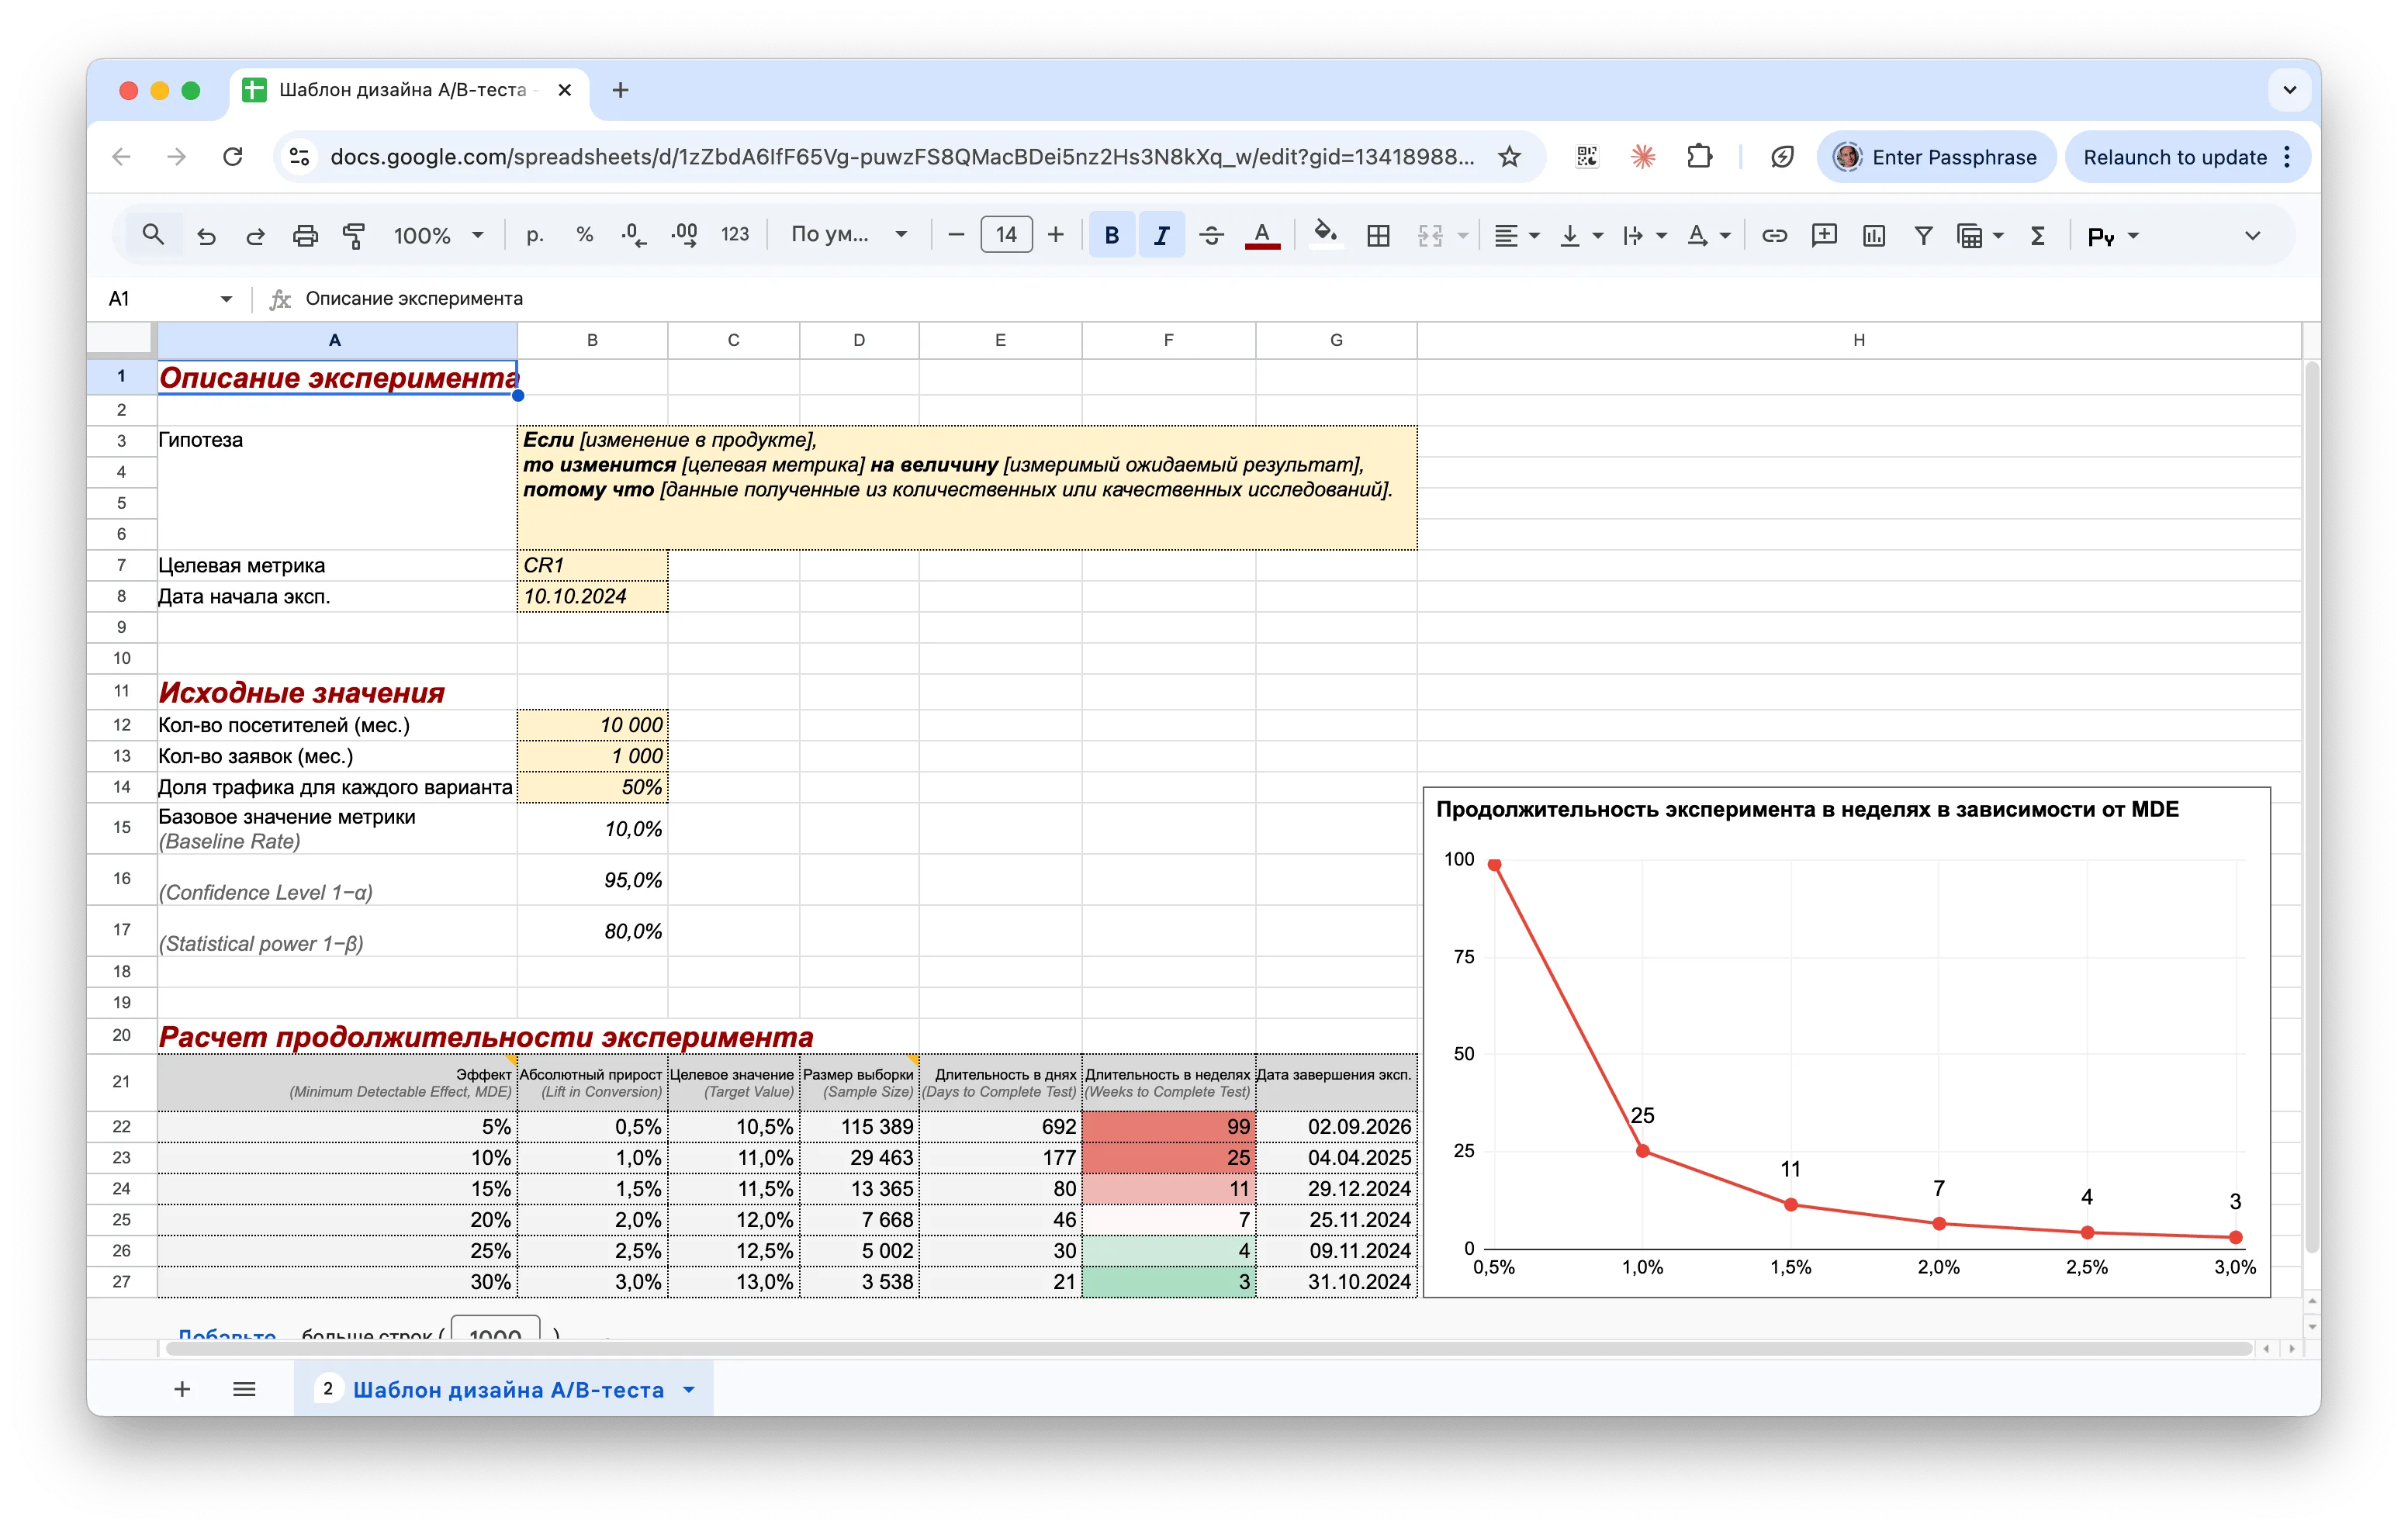
Duration calculation — the spreadsheet automatically calculates results for different MDE levels ranging from 5% to 30%. MDE (Minimum Detectable Effect) is the smallest effect size the experiment is capable of detecting. For example, an MDE of 10% at a baseline conversion rate of 10% means the test will detect a shift in conversion up to 11% (an absolute lift of 1%), but will miss smaller changes. The spreadsheet calculates:
- Lift in Conversion
- Target Value
- Required Sample Size
- Duration in days and weeks
- Experiment end date
The smaller the effect you want to detect, the longer the test needs to run. For example, with a baseline conversion rate of 10% and 10,000 monthly visitors: detecting a 5% MDE will take ~692 days, while a 20% MDE requires just ~46 days.